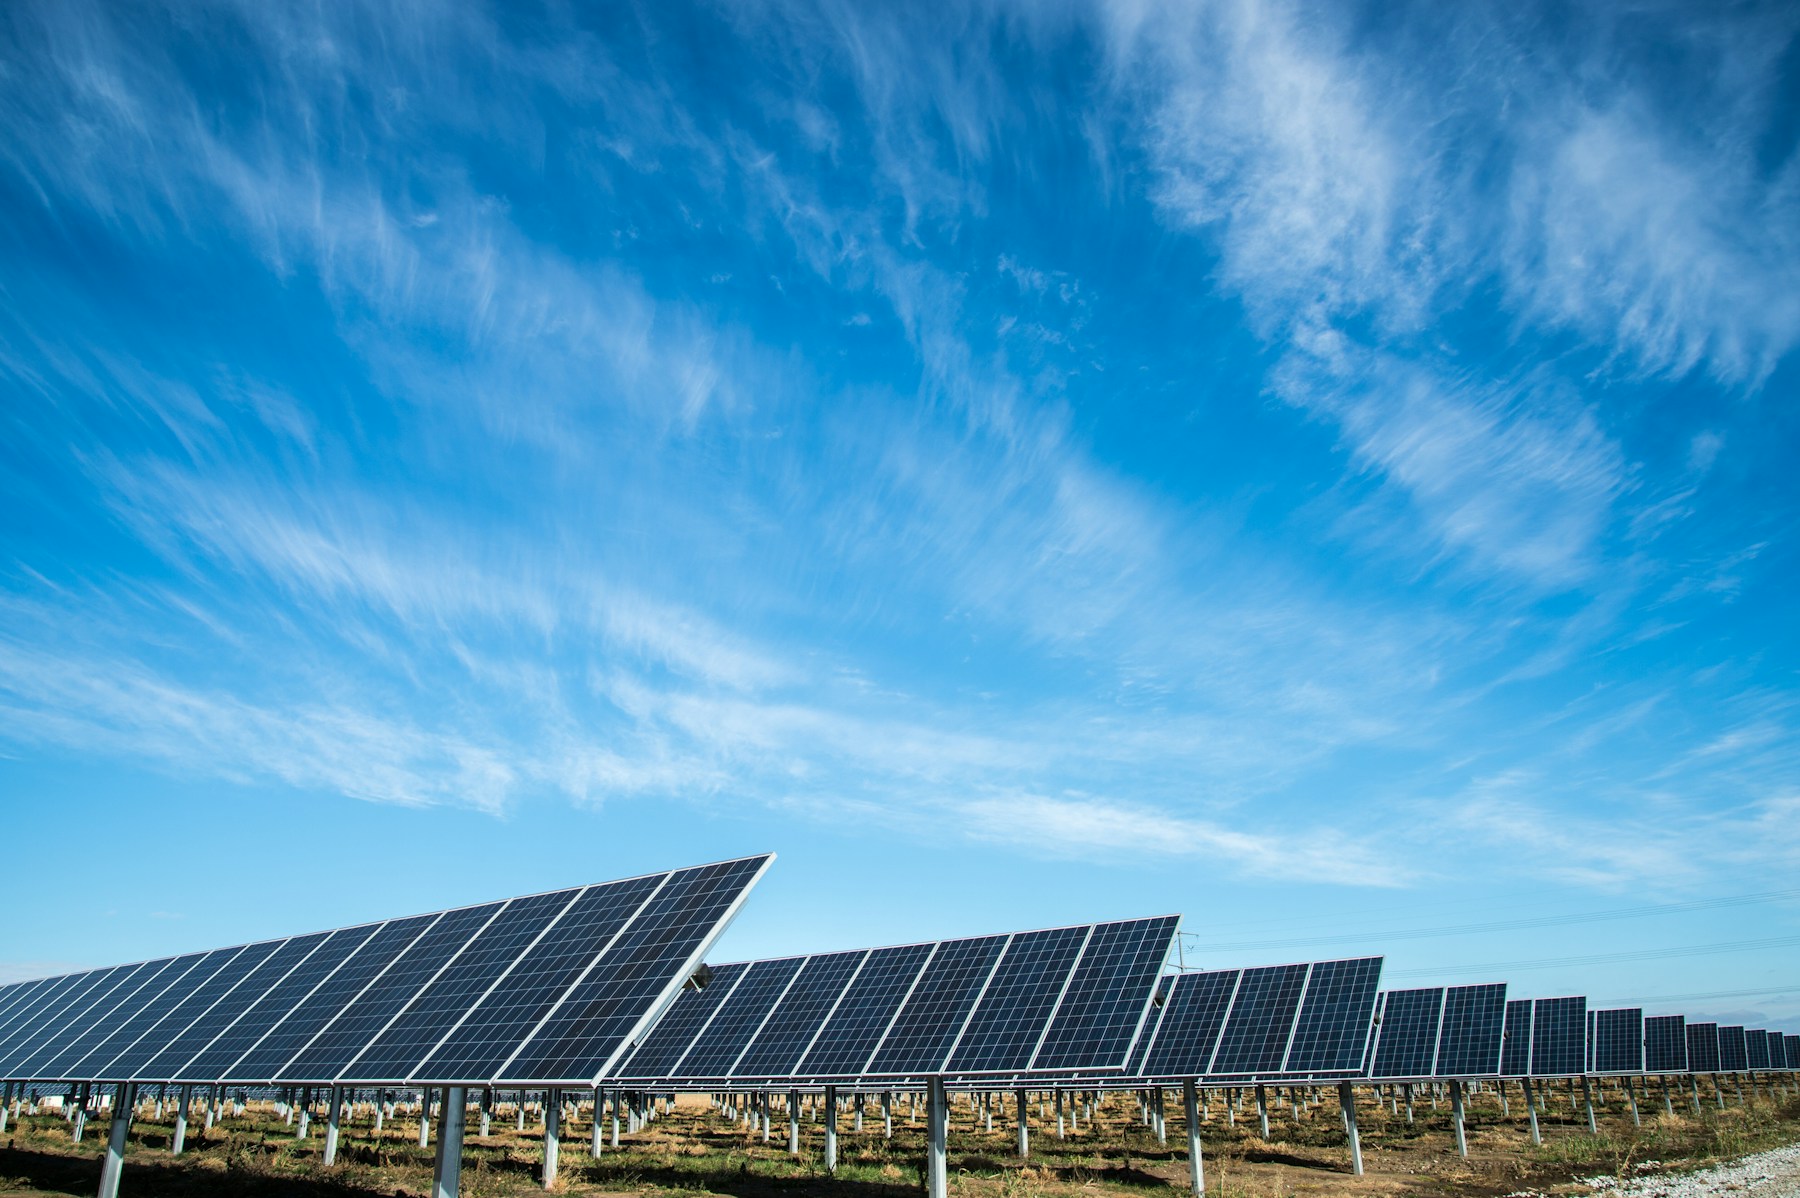
SOLAR DECISION INTELLIGENCE
Turn sunlight into measurable impact.
Know what your roof can generate, save, and avoid—before you invest.
European Commission PVGIS · Location-specific modelling · Transparent assumptions · No account required
Recommended system
7.65 kWp
- Annual production
- 10,409 kWh
- First-year savings
- ₺28,800
- Simple payback
- 5.8 years
- Avoided CO₂ / year
- 4.37 t
Illustrative scenario, not a live result or a quote.
ONE ROOFTOP, MEASURABLE IMPACT
From sunlight to a decision, in one line.
Capacity drives generation. Generation drives savings, payback, and avoided emissions.
Illustrative scenario · Maltepe, Istanbul · 120 m² usable roof
Recommended system
7.65 kWp
Demand-matched, roof-capped
Annual clean generation
10,409 kWh
Year-one PVGIS-style yield
First-year savings
₺28,800
Annual energy matching
Simple payback
5.8 years
On ₺167,000 project cost
25-year savings
₺678,411
0.5%/yr degradation, real prices
Avoided CO₂ / year
4.37 t
0.42 kg CO₂ per kWh
Tree equivalent
208 trees
Illustrative, 21 kg CO₂ / tree / yr
THE DECISION REPORT
One report. Nothing hidden behind it.
Live, location-specific yield
Monthly production from PVGIS for your exact coordinates.
Sized to demand, capped by roof
Your bill sets the target; your roof sets the limit.
Every assumption editable
Panels, losses, degradation, and emission factor stay in your hands.
Demand-matched system within roof capacity.
HOW IT WORKS
Locate. Model. Decide.
- 01
Locate
Search a city or district; coordinates come from Open-Meteo.
e.g. Maltepe → 40.94° N, 29.16° E
- 02
Model
Roof, bill, tariff, and cost meet live PVGIS production.
Roof area · Bill · Tariff · Cost/kWp
- 03
Decide
Read size, savings, payback, and emissions in one report.
Break-even year on a 25-year chart
SOLARSCOPE IN USE
60 people. 10 cities. One clearer path to solar.
From Istanbul to Bremen and Seattle, people used SolarScope to turn their own roof, energy, and location data into clear system, savings, payback, and environmental outcomes.
01Reach
- 60
- people used SolarScope
- 10
- cities
- 3
- countries
- 92%
- said evaluating a solar investment became easier
- 16
- documented user responses
- 12
- submitted solar analyses
- 100%
- completed a calculation
- 100%
- rated usability 4/5 or 5/5
92% = 12 of 13 respondents who evaluated a decision; one answered “partially.”
Across Türkiye and beyond
Documented responses across 10 cities in Türkiye, Germany, and the United States.
02Impact
What users discovered
Real rooftop inputs became measurable energy, financial, and environmental outcomes.
Solar potential
Recommended capacity
116.10 kWp
Solar potential
Clean-energy potential
145,237 kWh/yr
Financial potential
First-year savings potential
- TRY 405,558
- €1,334
- $1,800
6.33 years average simple payback
Environmental potential
Avoided CO₂ per year
61.14 t
2,911 illustrative tree equivalents
Combined from 12 user-generated analyses using location-specific PVGIS production data and user-provided project inputs.
+2.4 points
in understanding
Average self-rated understanding on a 1–5 scale moved from uncertainty to strong understanding, turning abstract ideas into measurable financial and environmental outcomes.
Before SolarScope
2.2 / 5
After SolarScope
4.6 / 5
03Voices
Outcomes across locations
Istanbul · Five combined analyses
- Recommended capacity
- 29.25 kWp
- Annual generation
- 39,813 kWh
- First-year savings potential
- TRY 114,800
- Average payback
- 6.44 years
- Annual CO₂ avoidance
- 16.71 t
- Tree equivalents
- 796
What users said
SolarScope helped me assess both the financial return and the environmental contribution of installing solar panels. I have already recommended it to my colleagues.
Seeing the payback period and estimated first-year savings made the decision much clearer for me.
Being able to see the 25-year financial outlook was especially valuable. The tool answered my questions and served its purpose clearly.
It gave me a practical way to evaluate the energy-system investments I plan to make.
An excellent project.
A remarkably smart renewable-energy application. It will be useful to me, and I congratulate Kerem on creating it.
Comments translated from Turkish where applicable.
SCALE THE IMPACT
What if more rooftops made informed solar decisions?
Based on the home example (7.65 kWp in Maltepe, Istanbul). Choose how many similar rooftops to imagine.
- Annual clean generation104 MWh
- First-year savings₺288,000
- Avoided CO₂ per year43.72 t
- Illustrative tree equivalent2,082 trees
- 25-year savings₺6.8M
These figures are illustrative scaled scenarios, not live platform totals or guaranteed outcomes.
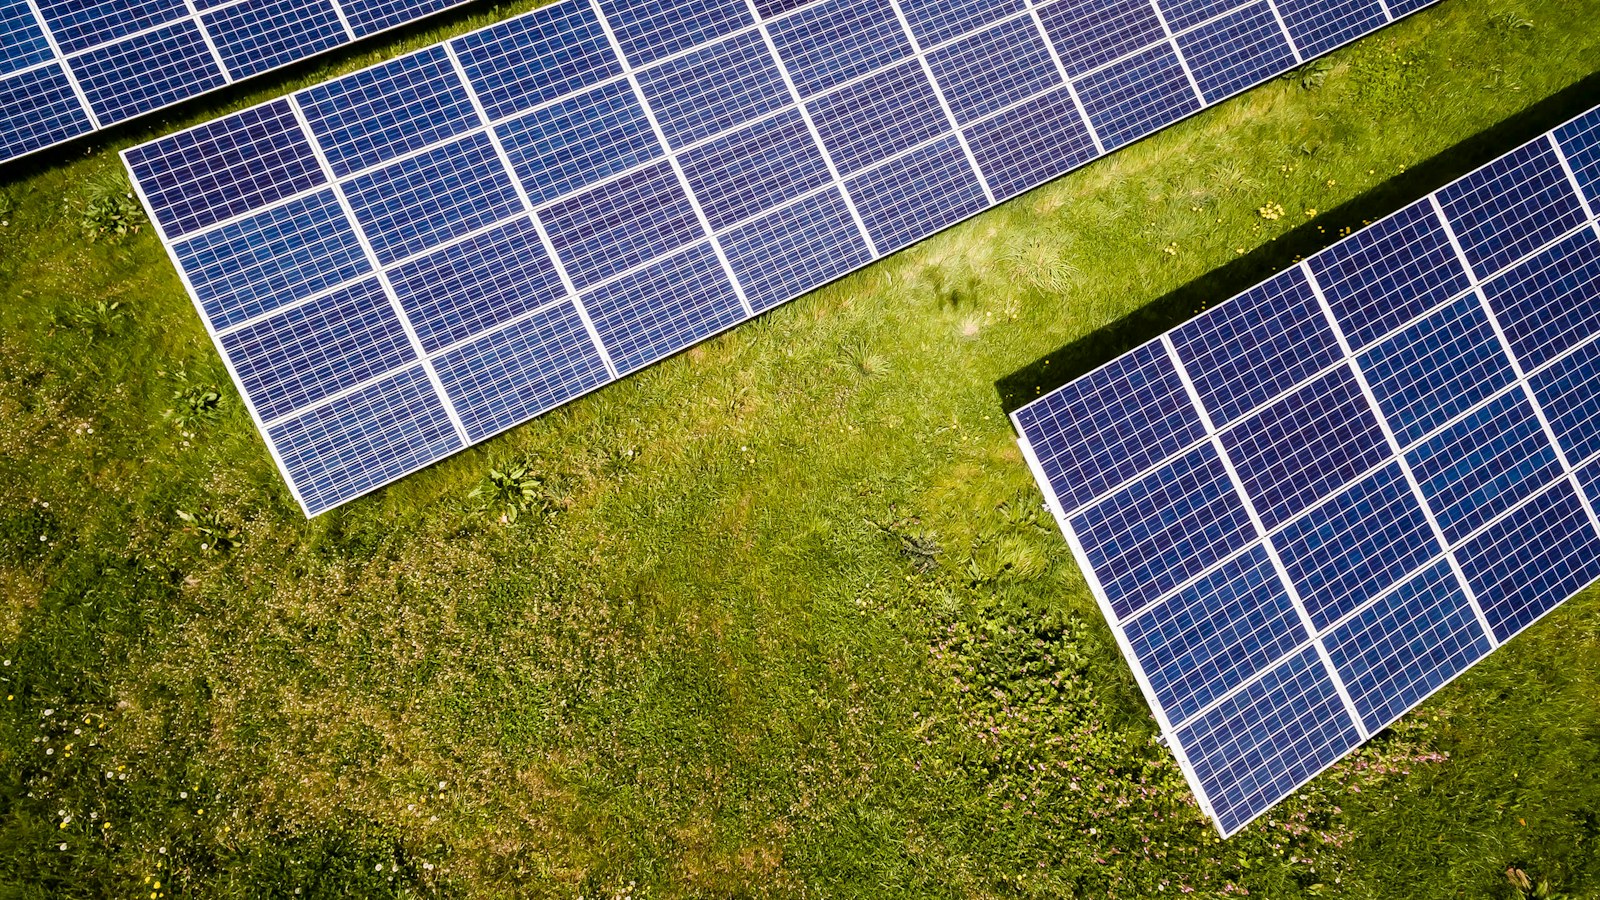
Energy made measurable
Location-specific production translated into system size, generation, savings, and payback.

Impact made visible
Estimated clean-energy production translated into avoided emissions and illustrative tree equivalents.
Built on public data. Designed for transparent decisions.
Assumptions stay editable and every formula is documented. Educational estimates only—not engineering, financial, or installation advice.
FAQ
Before you model a rooftop.
Your roof already has a dataset.
Turn it into a transparent solar investment scenario.
No account required for an initial analysis.